After completing supplier screening, we mapped all candidate suppliers onto geographic coordinates and generated a distribution heat map. The results revealed a dimension that is typically overlooked: geographic concentration.
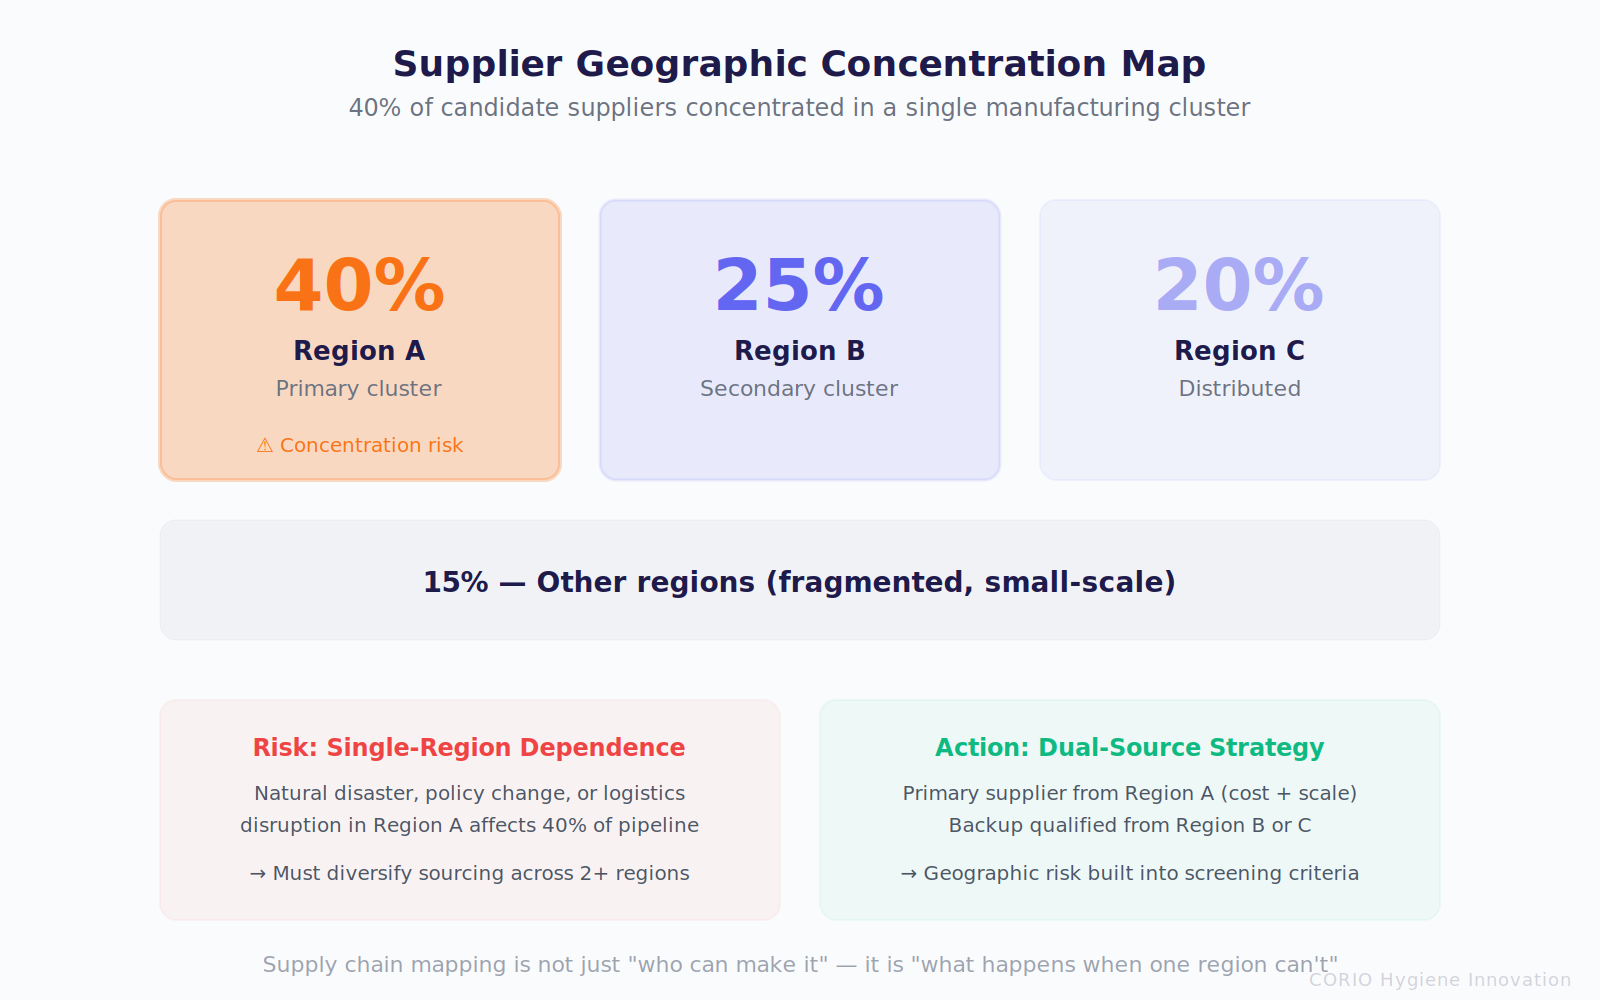
Approximately 40% of candidate suppliers were concentrated within a single manufacturing cluster. This is simultaneously an advantage and a risk — the advantage being that clusters offer mature upstream-downstream support, logistics efficiency, and concentrated technical talent; the risk being that if that region experiences disruption, the client's supply chain resilience faces systemic exposure.
More importantly, the geographic distribution revealed structural differences across material categories: topsheet suppliers were highly concentrated in a few regions (reflecting raw material and equipment dependencies), backsheet suppliers were relatively dispersed (reflecting the parallel development of two technology routes), and ADL suppliers showed geographic coupling with backsheet producers — because many ADL production lines operate as secondary lines within backsheet facilities.
This heat map is not static reference material. It became a tool for supplier strategy — when you know that a specific region has only two suppliers with a particular capability, you have a more precise assessment of your negotiation landscape; when you discover an emerging supplier in another region, you know alternative options are forming. Geographic analysis shifts from curiosity to a quantitative input for procurement strategy — feeding directly into progressive expansion planning and supplier qualification.