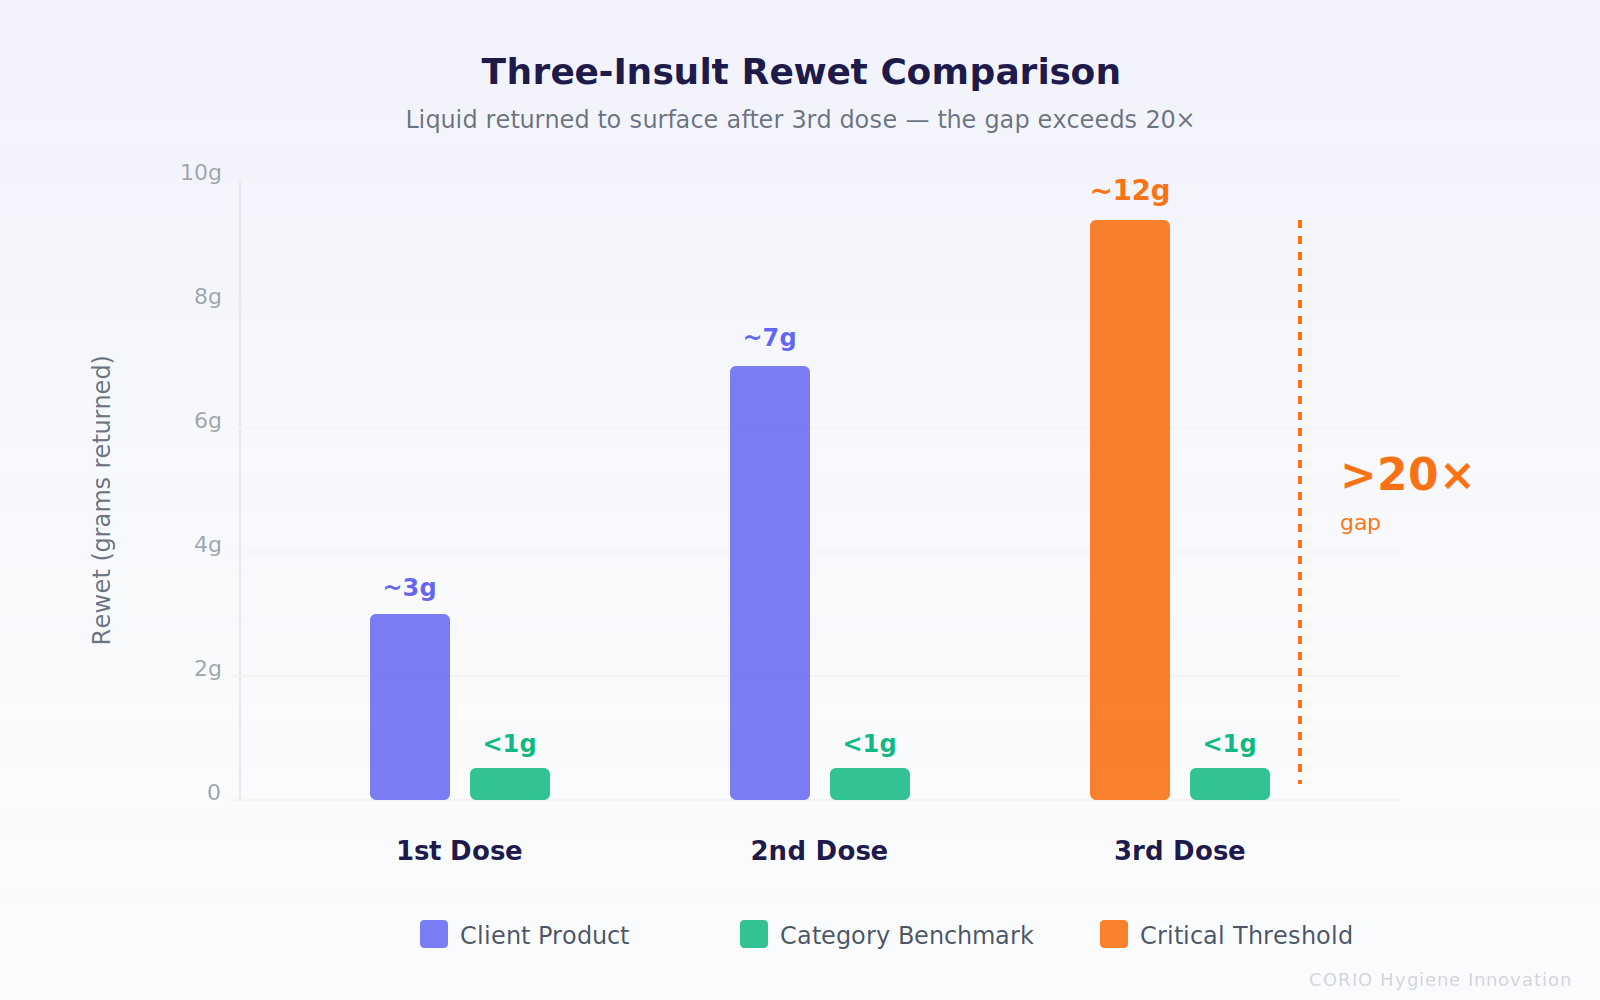
Standard testing typically uses one or two liquid additions. We ran three sequential doses to simulate real overnight use. The gap fully revealed itself at the 3rd dose: the client's product returned approximately 12g of liquid, while the category benchmark returned under 1g — a gap exceeding 20×. This is not "room for improvement." This is structural failure.
But the data revealed a more hidden problem: batch consistency. The client product's 12-hour overnight rewet coefficient of variation (CV) reached 38.5%, versus 22.4% for the competitive benchmark. For a DTC brand, consistency is brand equity — consumers will not accept "this one works, the next one doesn't." Importantly, a high CV does not necessarily indicate poor manufacturing control — it can reflect the core architecture's inherent sensitivity to batch-to-batch material variation. Fluff-pulp cores, which depend on physical blending of fibers and SAP, are structurally more sensitive to mixing uniformity than composite cores, where a carrier layer locks SAP positioning in place.
Further analysis traced the rewet collapse to three compounding root causes (validated through our multi-method verification protocol): macro-level core clumping, micro-level fiber wet-collapse, and SAP gel degradation reducing lock-up capacity. Fixing any single layer is insufficient — all three must be addressed simultaneously.
This data directly restructured the client's development priority ranking: core architecture upgrade moved from "worth doing" to "must do."