When we mapped competitors’ speed scores and dryness scores onto a two-dimensional coordinate system, a clear distribution pattern emerged: existing competitors clustered in three quadrants — “fast but mediocre dryness,” “dry but slow,” and “mediocre at both.” The fourth quadrant — “fast and dry” — was nearly empty.
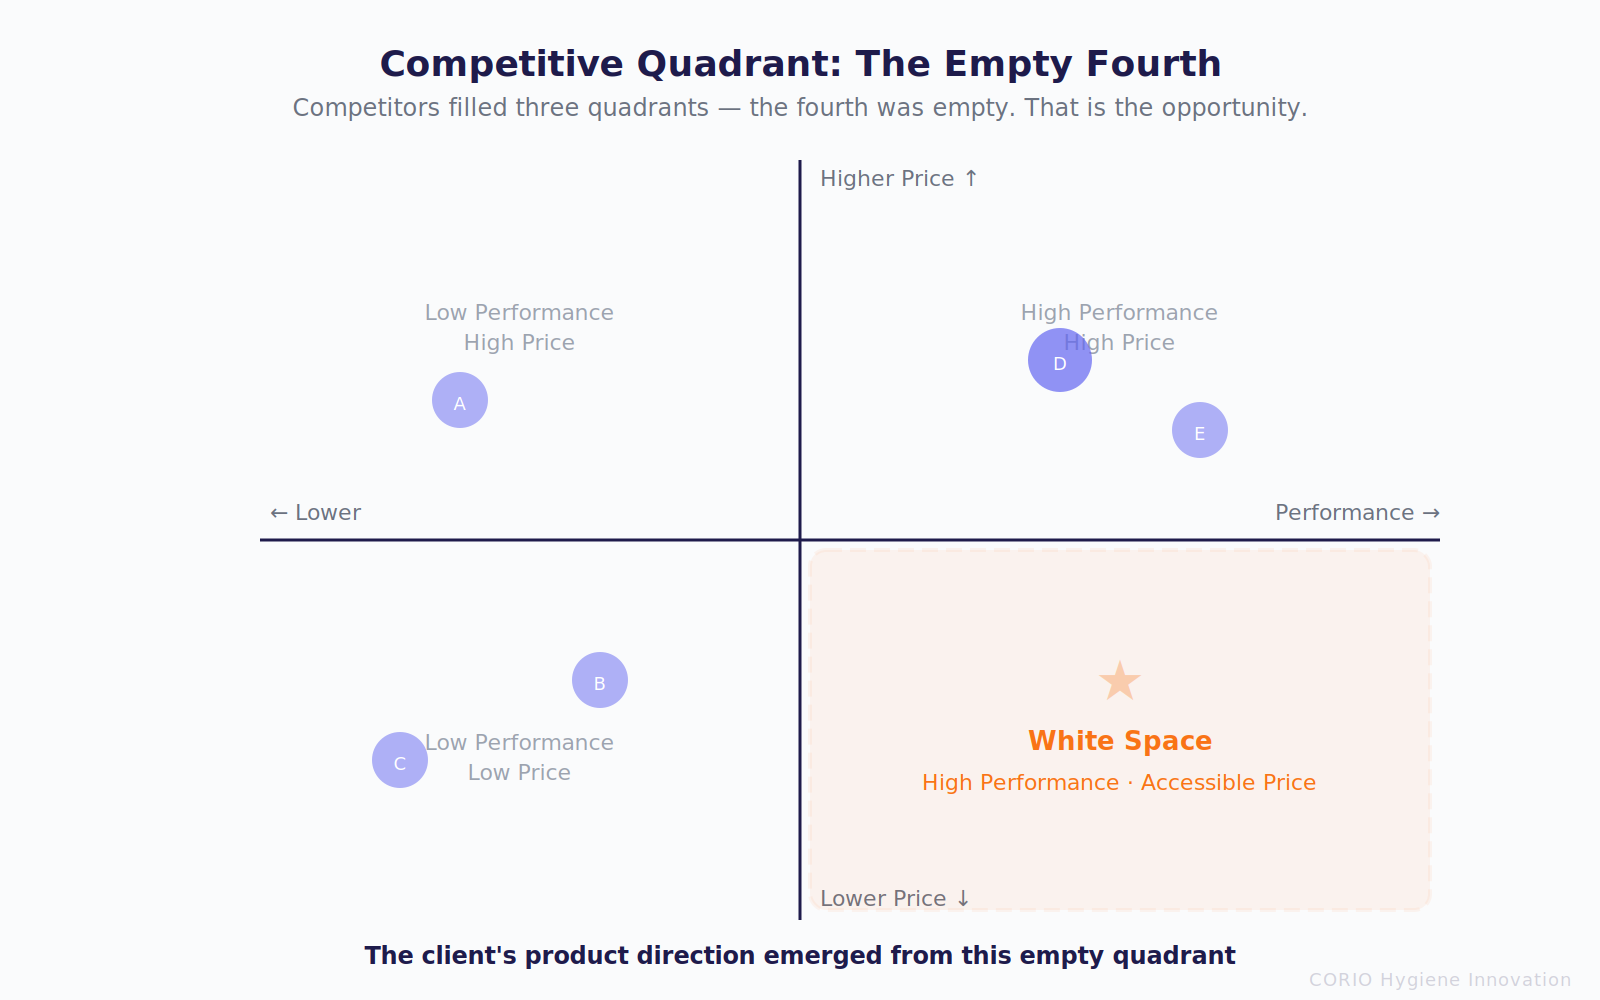
This gap is not accidental. Achieving speed-plus-dryness dual superiority requires specific core architecture and ADL configuration, and most manufacturers’ default processes trade off between the two. Our DOE testing had already demonstrated that recombining existing material layers into a different architecture could enter this empty quadrant — the DBE formulation simultaneously outperformed both the client’s product and the competitive benchmark on speed and dryness.
The quadrant analysis also revealed a cross-category risk signal: a brand occupying Q1 (the optimal quadrant) in the diaper chart dropped below Q3 in the pull-up chart — same brand, same consumer perception, but completely different engineering reality.
For the client, this chart translated a vague brand aspiration — “we want to make a premium pull-up” — into a precise engineering coordinate (mapped on our 4D competitive positioning chart): Q1 quadrant, speed score ≥70, dryness score ≥75.